Multi-Sensor

Data logging is not for everyone, but it is fun to keep stats of things in the house. Using a multi sensor can help with just that. Not an original idea, but inspired from here.
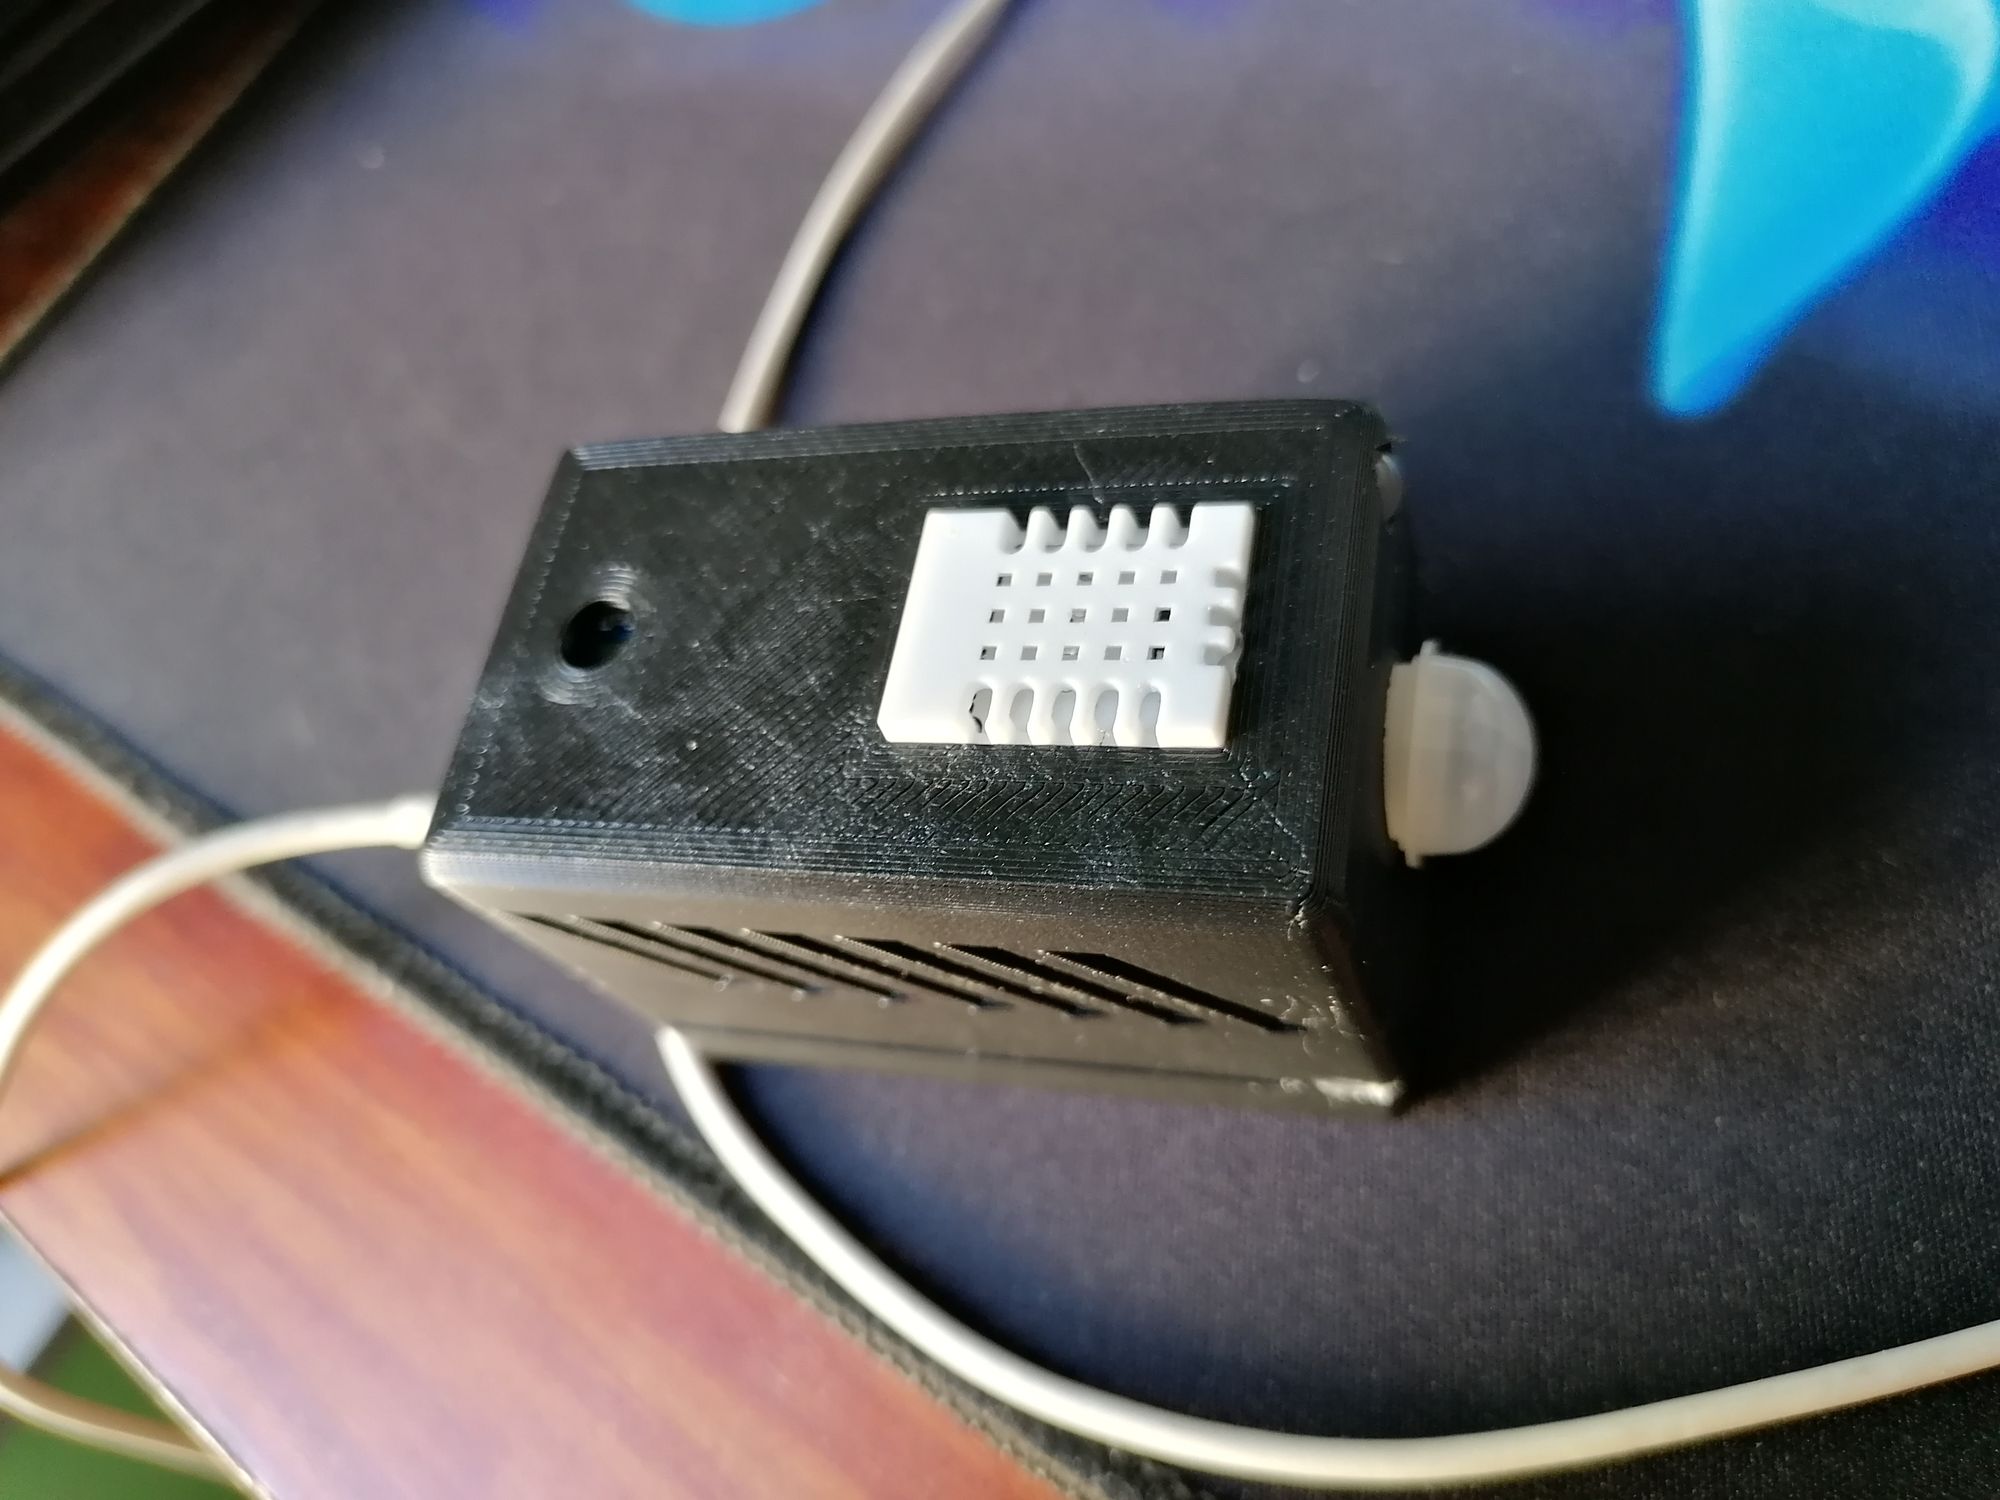
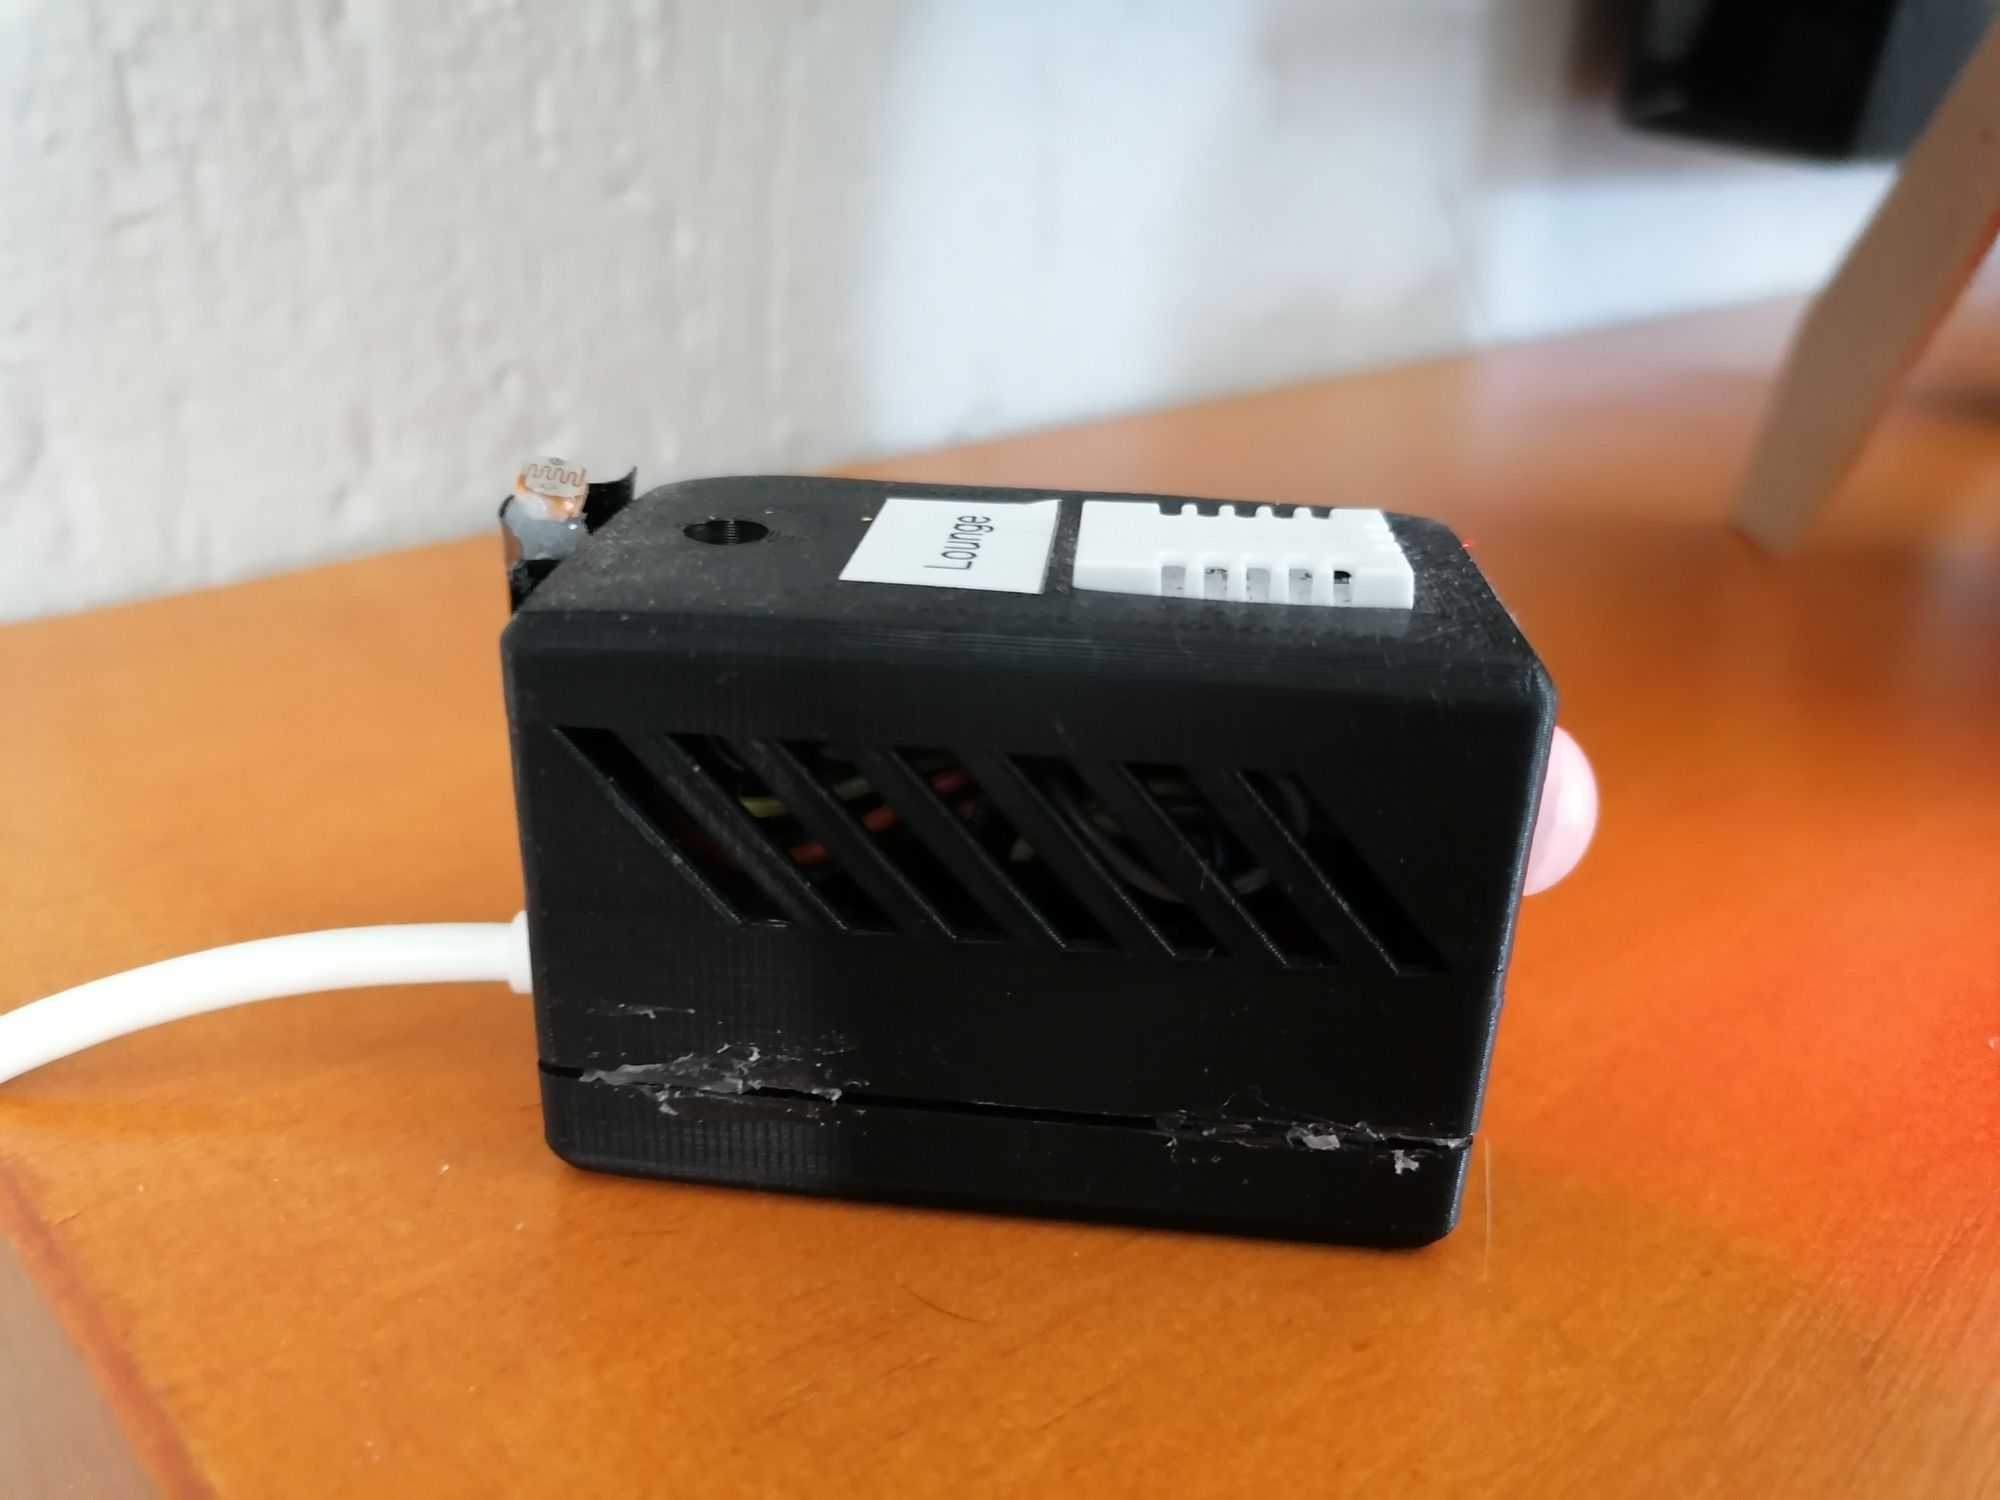
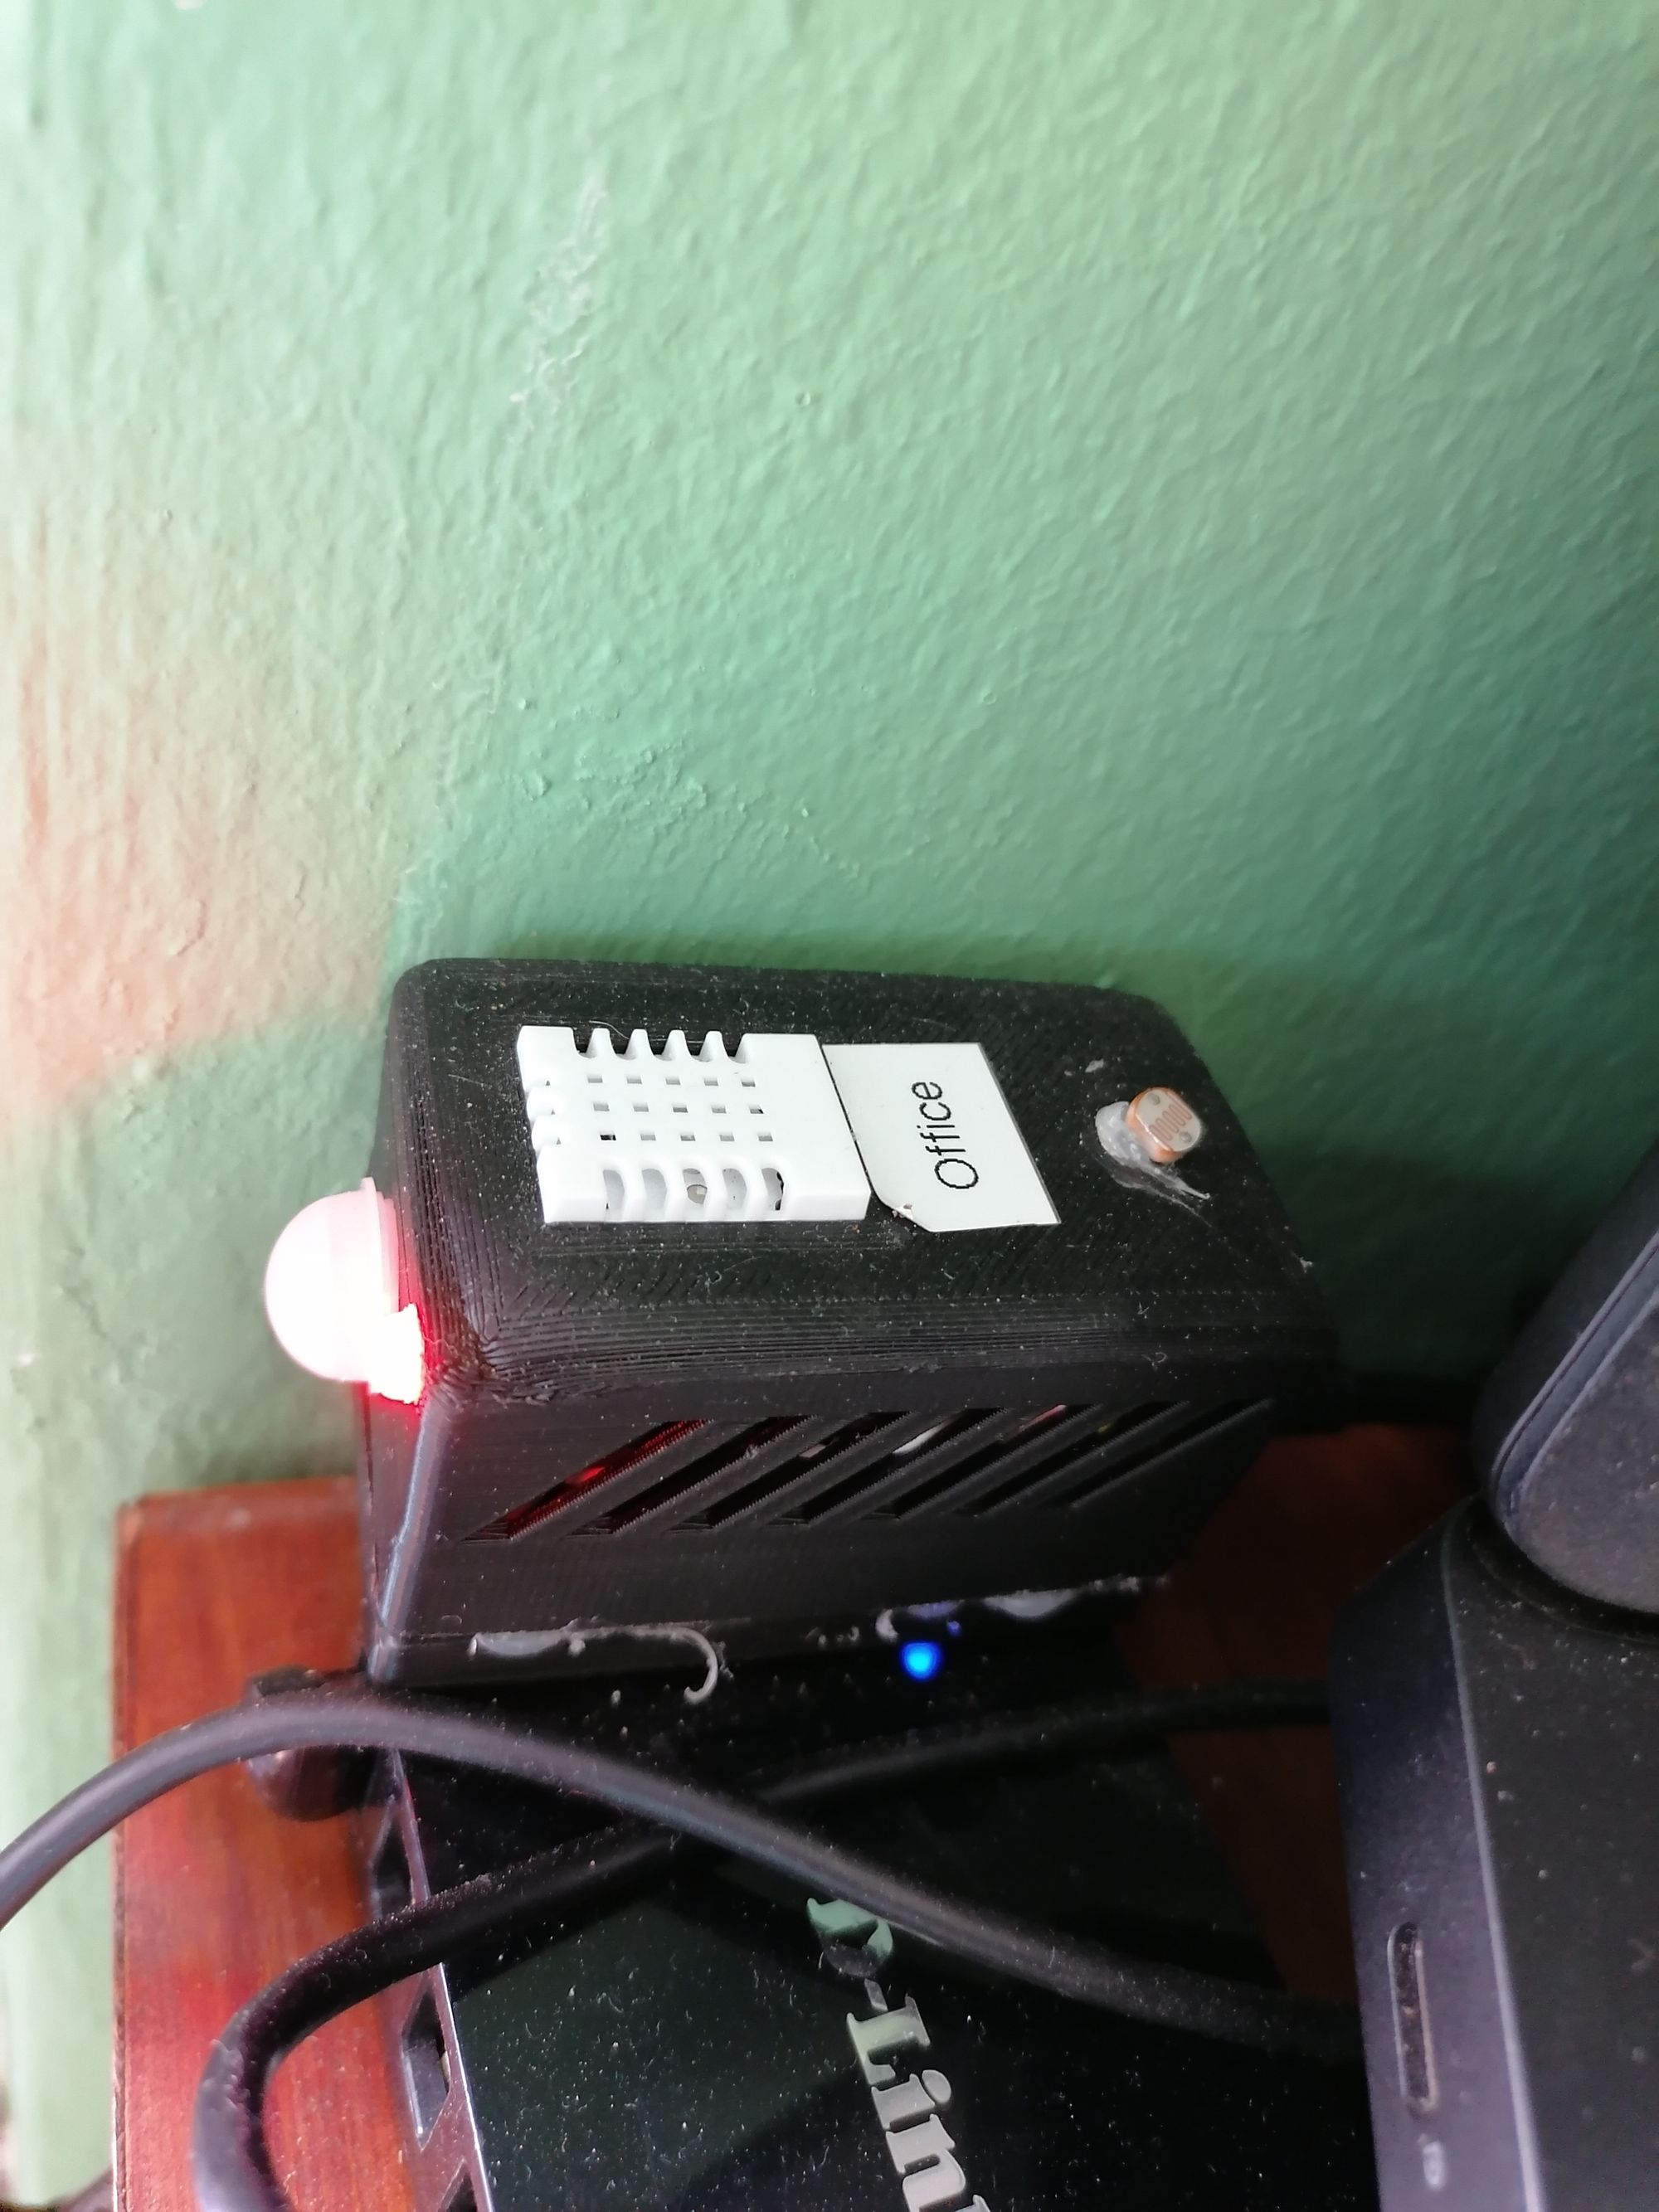
Originally this was to be a copy paste project, but I had to tweak and redo alot of the firmware to suite my needs. Using the 3D model that Bruh created. I printed out a few of them, and used the Wemos D1 Mini, A DHT22 Temp and Humidity sensor, some RGB leds, and a photoresistors. I could put together a data collecting and functional project.
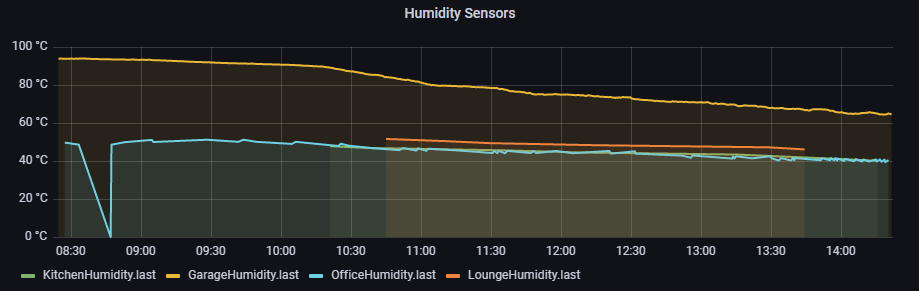
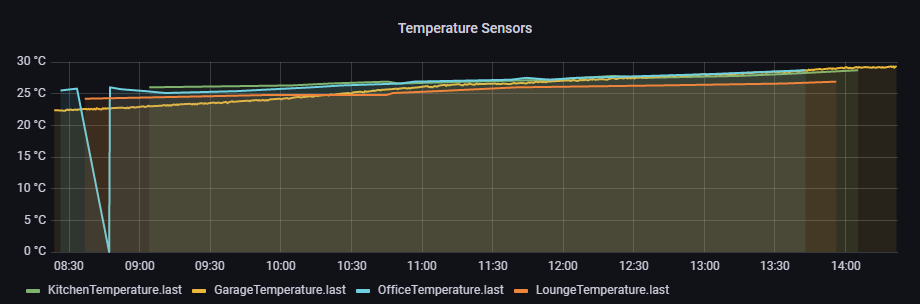
Tracking Temp and Humidity in each room and outside is great when plotting this is a visual graphing system like Grafana. Because... well why not.
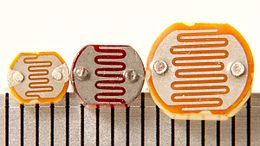
The photo resister measures light intensity in a room. You could you a dedicated LUX sensor, which I did, but I was getting better results with a cheap photoresistor, in mu case the photoresistor was more sensitive to light, the values changed more dramatically as apposed to the LUX sensor I used, the BH1750. The values can be used to determine when to switch lights on or off, for those dark overcast or rainy days when you need some extra light on in the house, this can assist in automating that process. Just one of many automations you could do with this sensor.
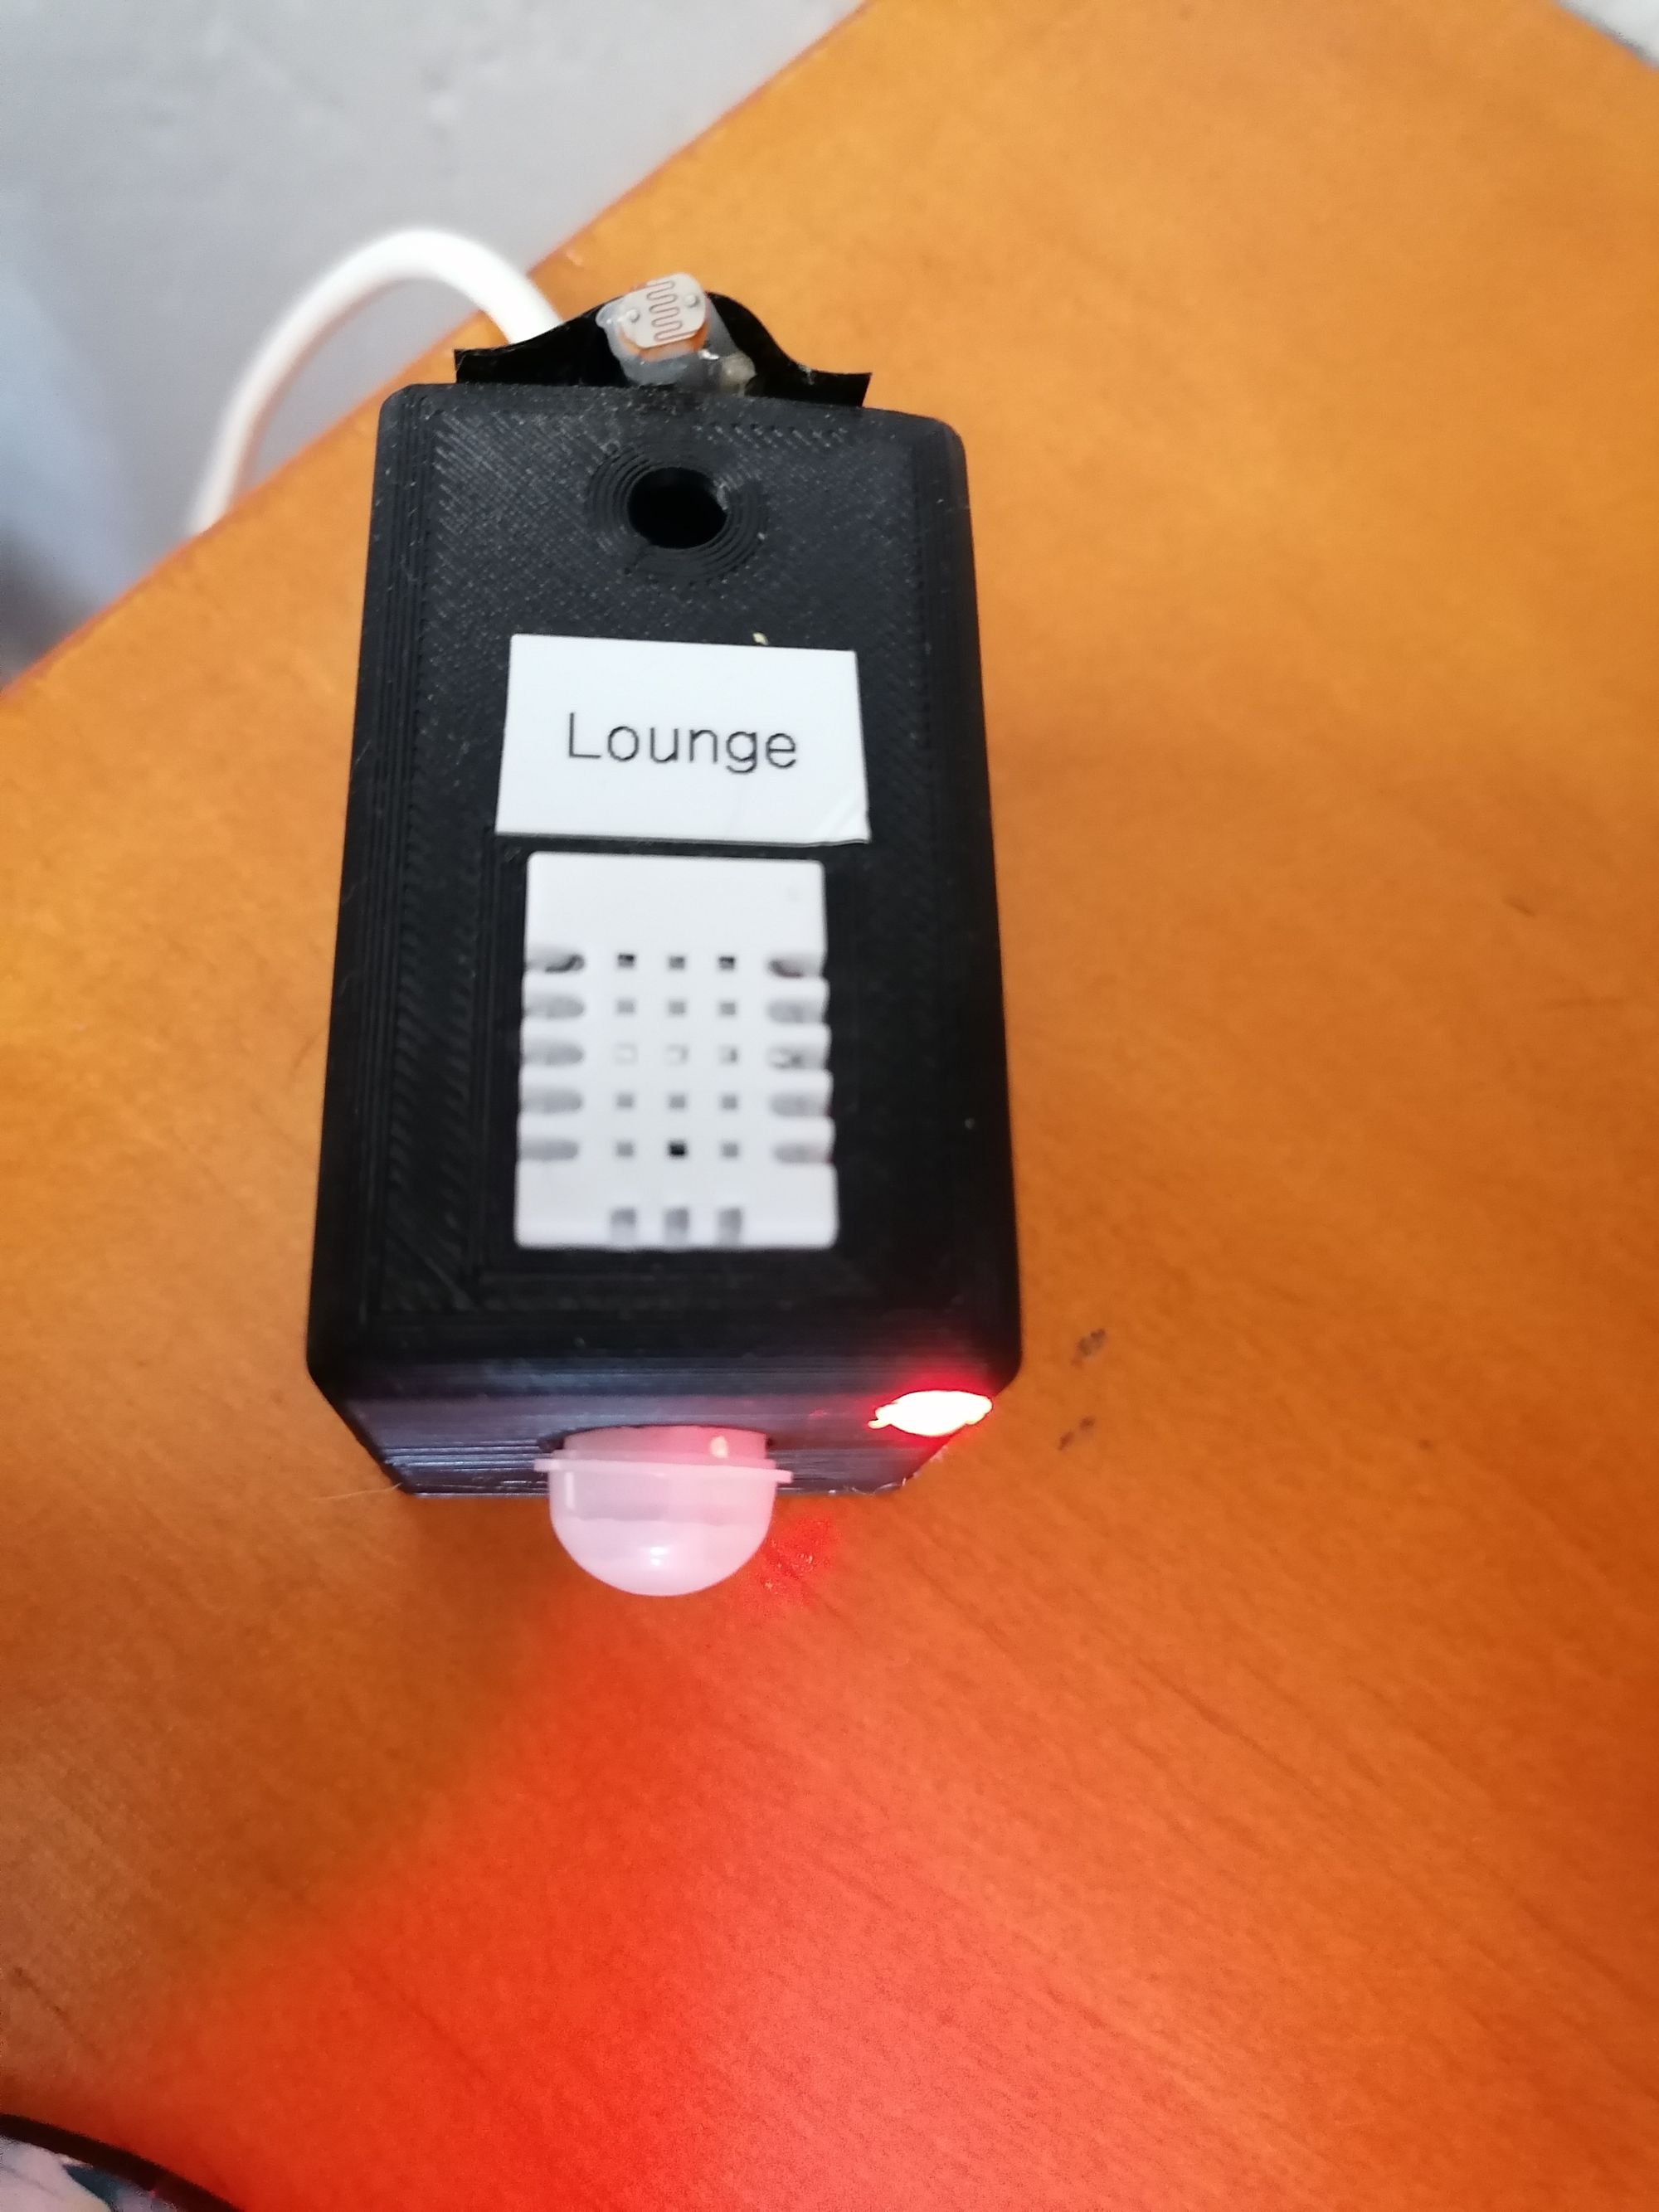
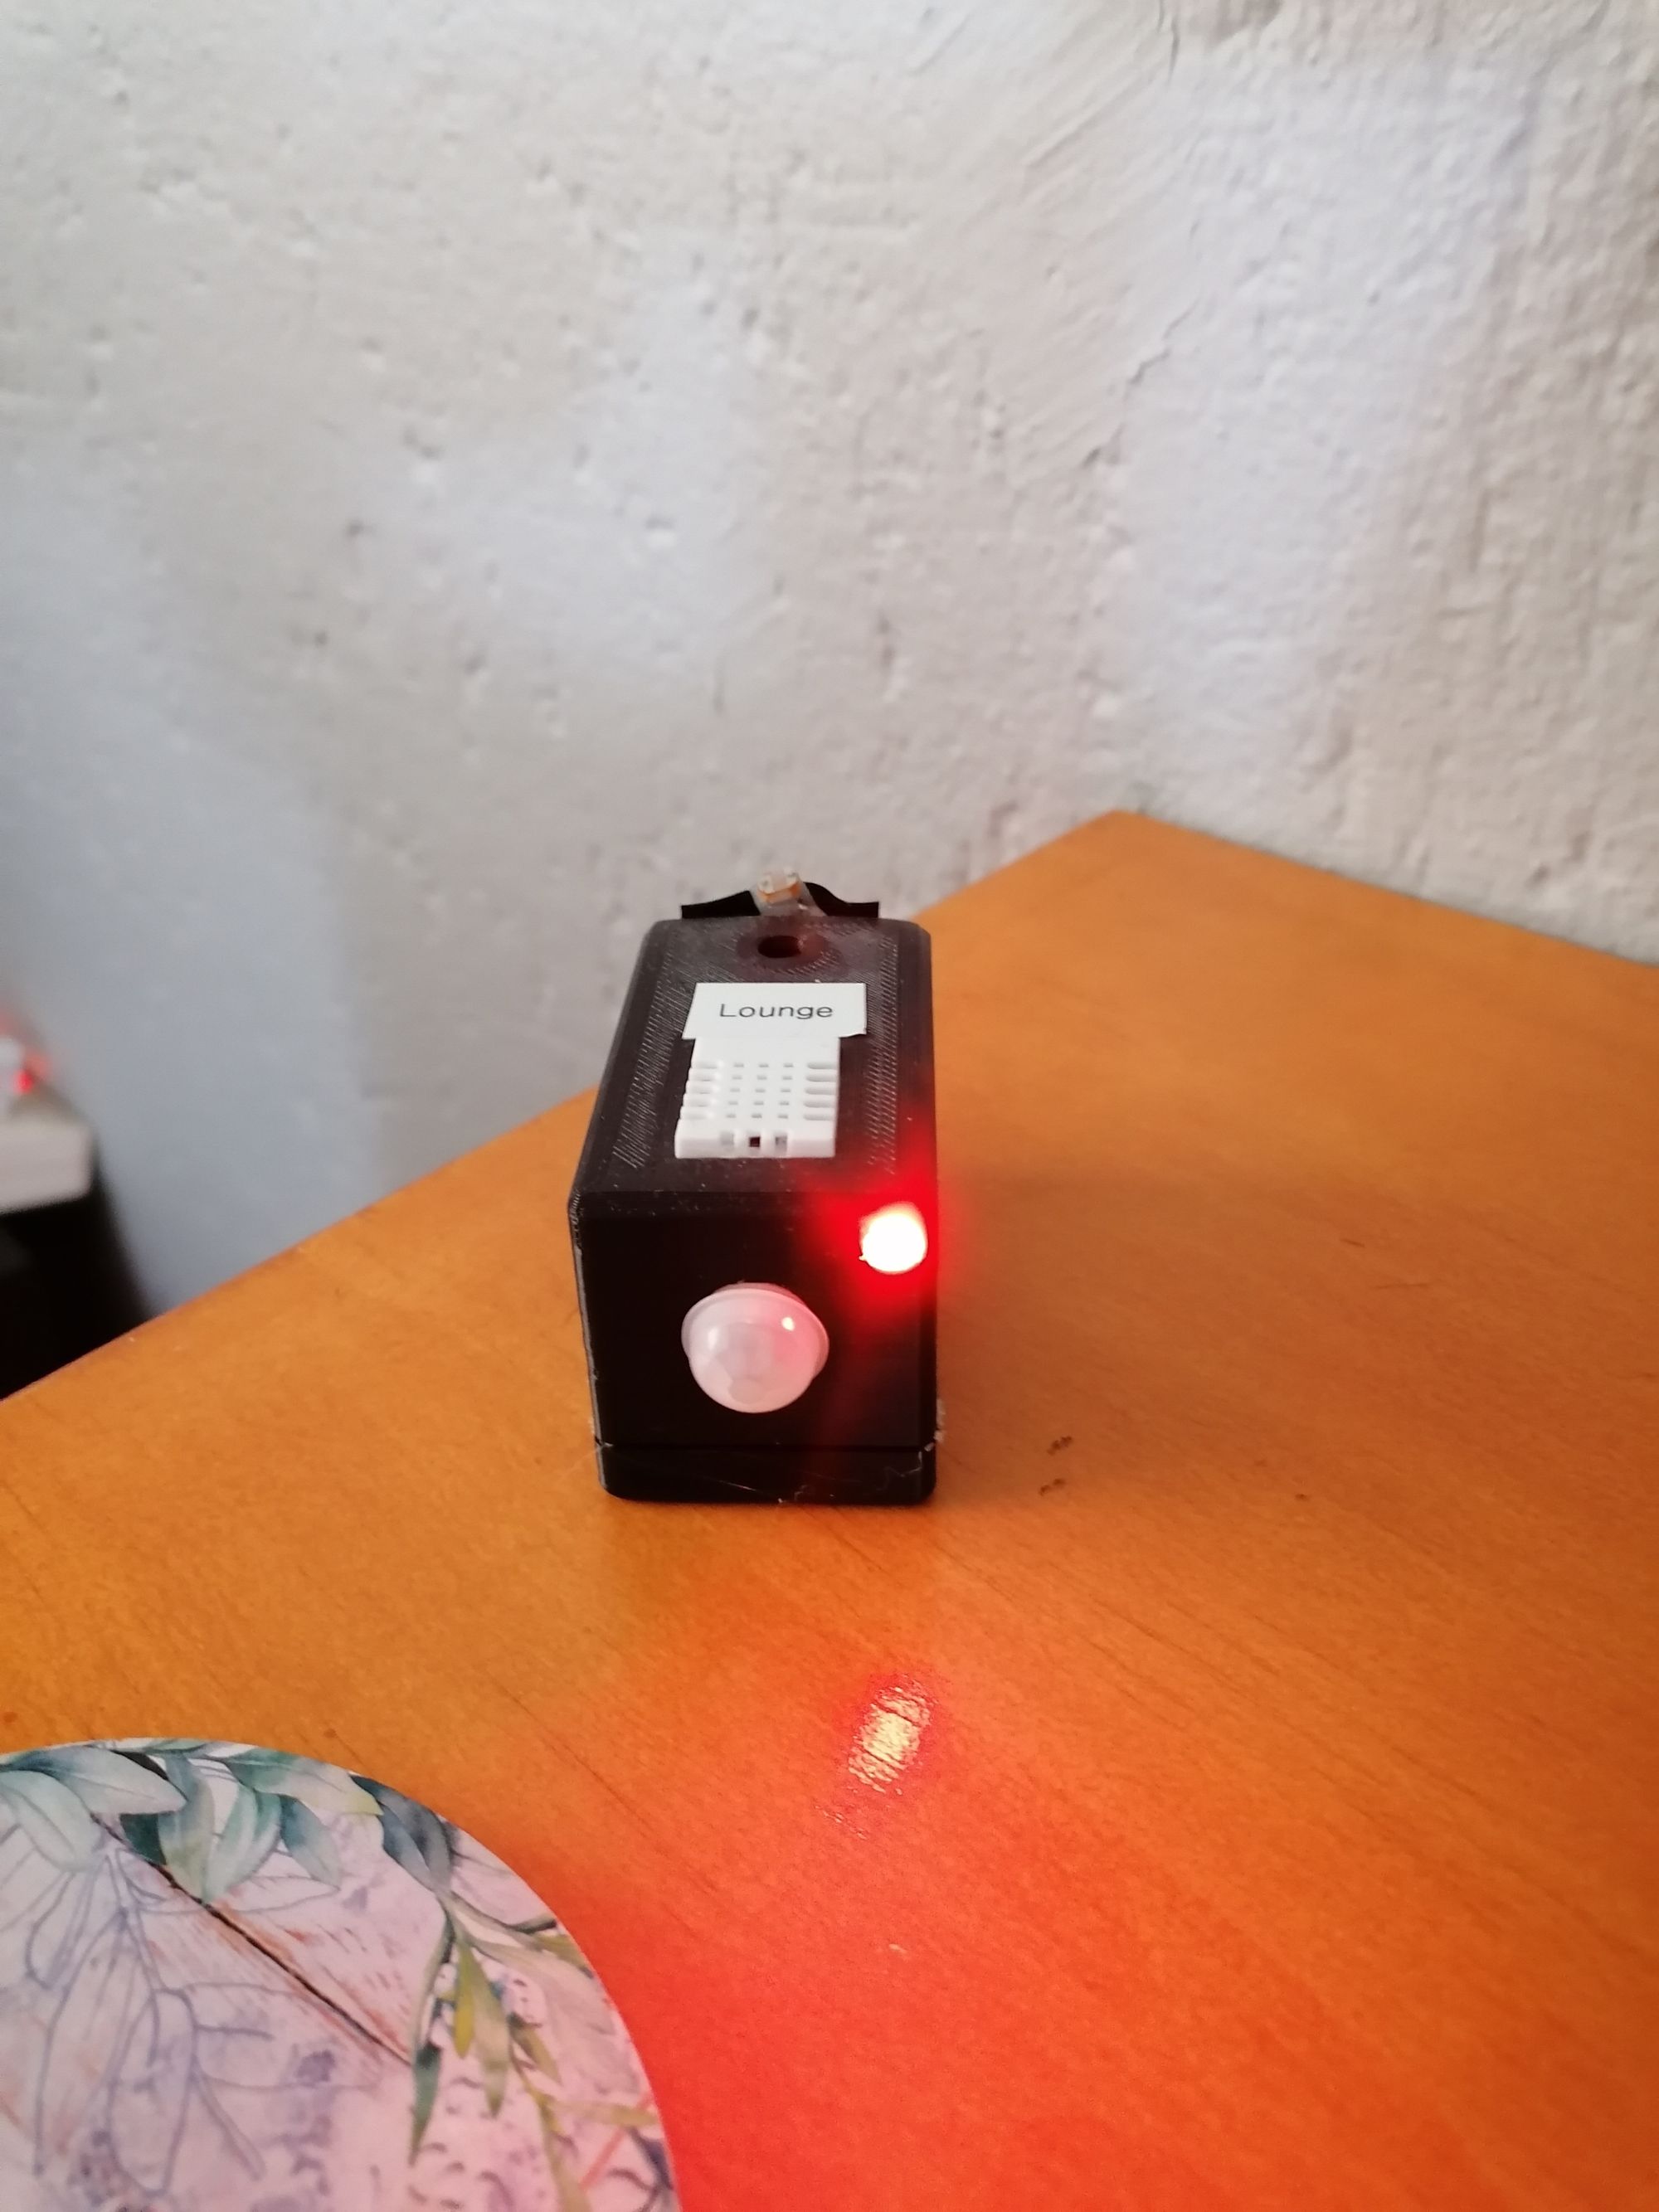
The RGB led in my case is useful for notifications. I use it for reminding me when a rooms windows are left open, or garage doors open. The usual for me, I make them glow red. When the door bell is rung, all these sensors through out the house will flash green for about half a minute or so.
In the front of the enclosure, I have a tiny motion sensor, I am using the AM312 PIR sensor. This is useful for room presense, turning a light on when entering or just notifying you of movement in a room, say when you not home. Allowing you to check the CCTV and see what is going on. The use of the sensors is limited by your imagination though, and what automation you need to make your life easier.
Below are some images of the sensors I have built and installed in a few of the rooms.
All these values and reading from the sensors are reported to openHab via MQTT protocol and using a JSON payload. Arduino has a great JSON library. I used to always create different topics for each type of reading from the sensors, but since finding the JSON Library, I can now publish to one topics and provide all the data in one payload. I also only publish data when a value has changed on one of the sensors. Insead of quering the sensors from openHAB side, I can keep the vales updated the second a sensor reading changes it will be published.
A simple method to check the sensor values
bool checkSensorValue(float newValue, float prevValue, float maxDiff) {
  return newValue < prevValue - maxDiff || newValue > prevValue + maxDiff;
}
If they have changed then I send the new states to openHAB
void sendState() {
StaticJsonBuffer<BUFFER_SIZE> jsonBuffer;
JsonObject& root = jsonBuffer.createObject();
root["state"] = (stateOn) ? on_cmd : off_cmd;
JsonObject& color = root.createNestedObject("color");
color["r"] = red;
color["g"] = green;
color["b"] = blue;
root["brightness"] = brightness;
root["humidity"] = (String)humValue;
root["motion"] = (String)motionStatus;
root["ldr"] = (String)LDR;
root["temperature"] = (String)tempValue;
root["heatIndex"] = (String)dht.computeHeatIndex(tempValue, humValue, IsFahrenheit);
char buffer[root.measureLength() + 1];
root.printTo(buffer, sizeof(buffer));
Serial.println(buffer);
client.publish(sensor_state_topic, buffer, true);
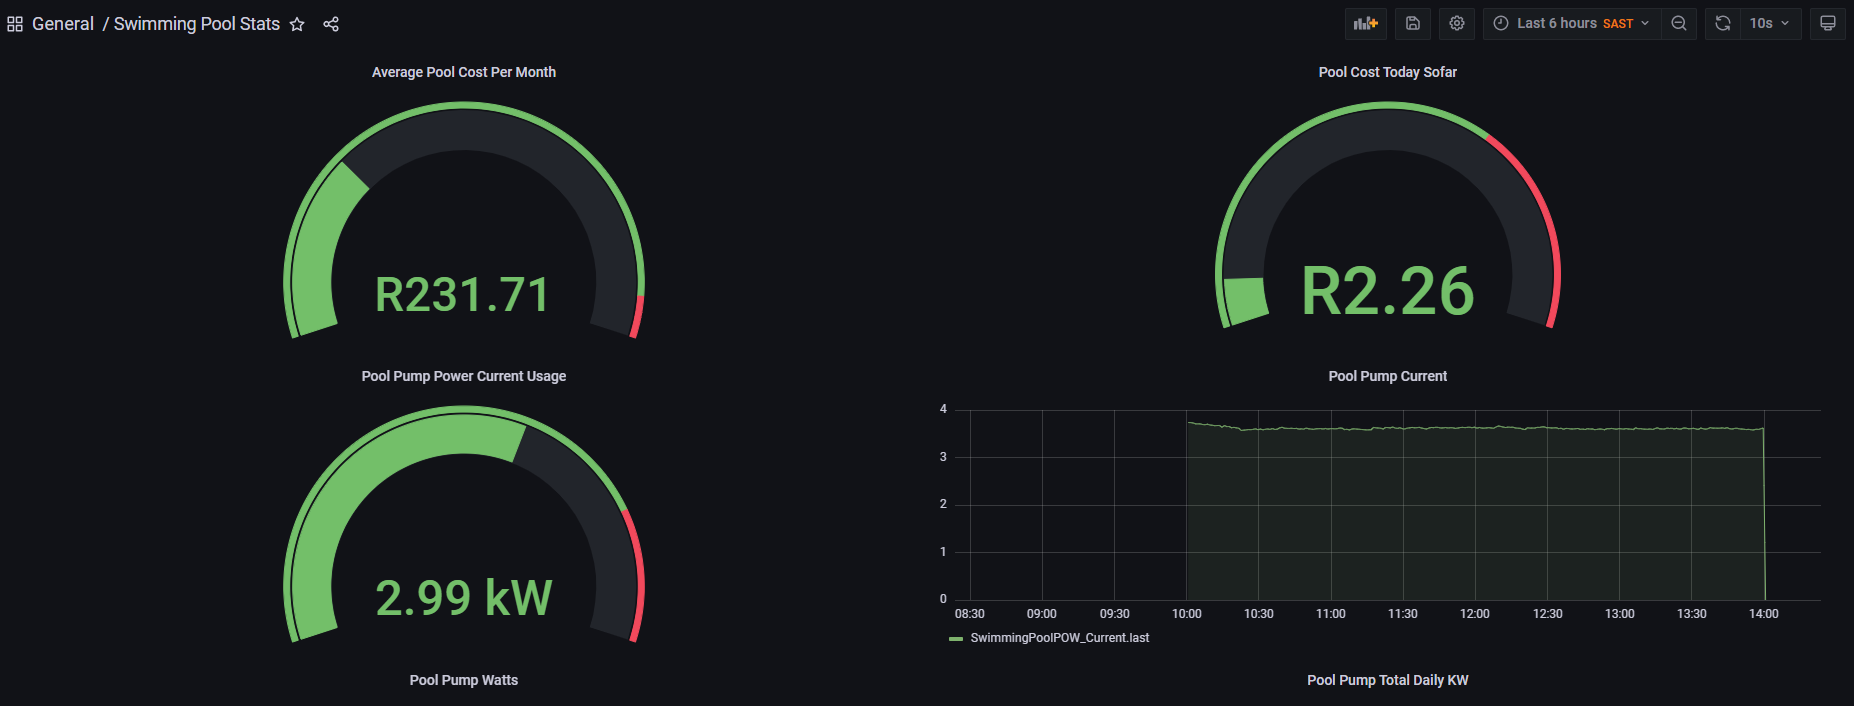
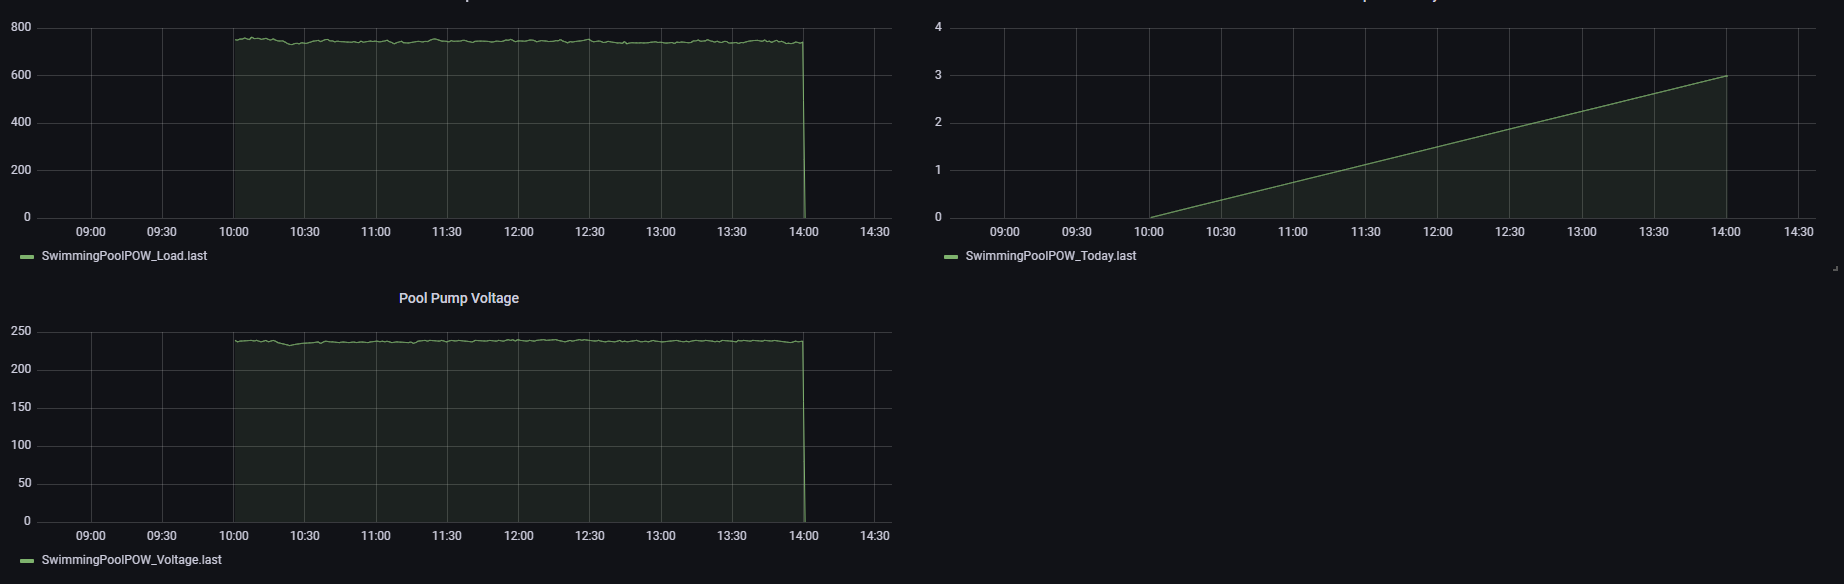
}Side note on Grafana
Since mentioning Grafana in this post, some more interesting things you can do is plotting power consumption usage by using smart plugs or switches, as well as do some cool calculations. See the images below. I have an average cost calulation, which is calculated during the running time of the pool pump each day. It's only average cost since our electricity is billed on a sliding scale of usage.